BioMassters: A Benchmark Dataset for Forest Biomass Estimation using Multi-modal Satellite Time-series


1Geomatics Unit, Faculty of Science, University of Liège
2Geoinformatics Division, KTH Royal Institute of Technology 3University of Montreal and Novosibirsk State University 4Data Science Institute, Imperial College of London 5Dendra Systems 6Driven Data
*Corresponding Author

Abstract

Above Ground Biomass is an important variable as forests play a crucial role in mitigating climate change as they act as an efficient, natural and cost-effective carbon sink. Traditional field and airborne LiDAR measurements have been proven to provide reliable estimations of forest biomass. Nevertheless, the use of these techniques at a large scale can be challenging and expensive. Satellite data have been widely used as a valuable tool in estimating biomass on a global scale. However, the full potential of dense multi-modal satellite time series, in combination with modern deep learning approaches, has yet to be fully explored. The aim of the "BioMassters" data challenge and benchmark dataset is to investigate the potential of multi-modal Sentinel-1 SAR and Sentinel-2 MSI satellite data to estimate forest biomass at a large scale using the Finnish Forest Centre's open forest and nature airborne LiDAR data as a reference. DrivenData hosted a machine-learning competition to estimate Above-Ground Biomass (AGB) in the forests of Finland. The performance of the top-three baseline models shows the potential of these techniques to produce accurate and higher-resolution biomass maps.

Data Collection Methods

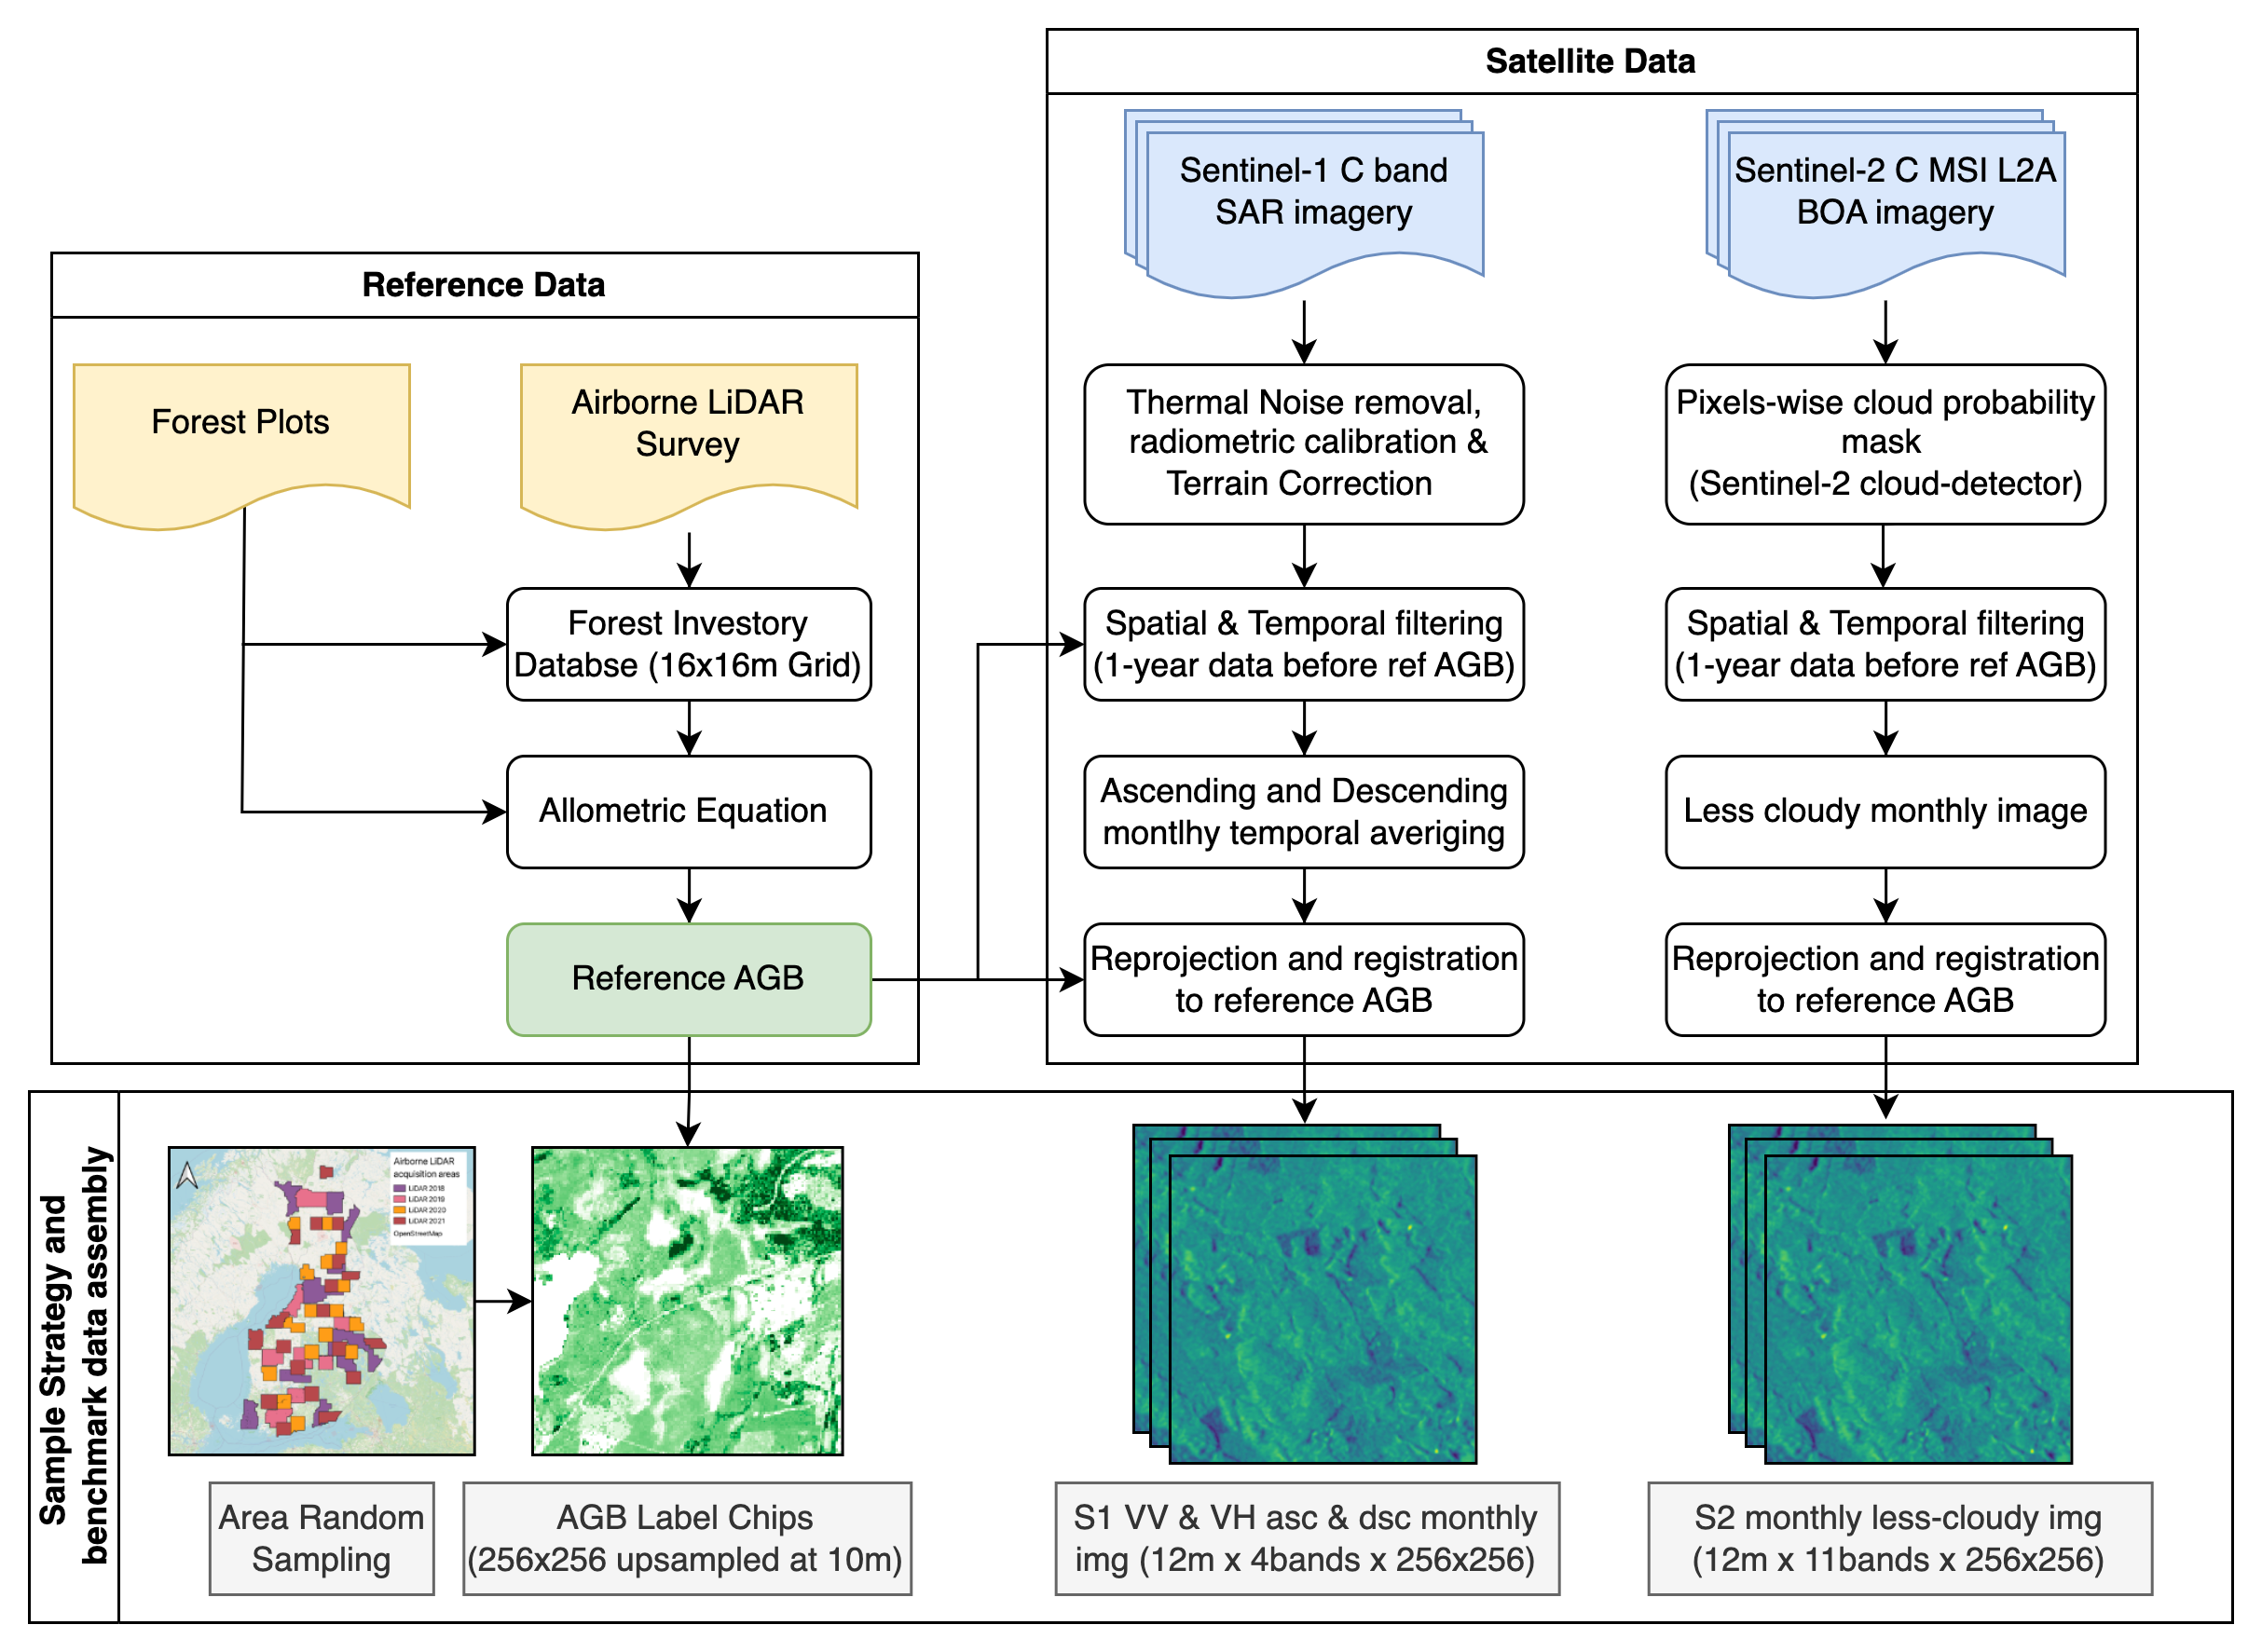
The feature data for this dataset is imagery collected by the Sentinel-1 and Sentinel-2 satellite missions for nearly 13,000 patches of forest in Finland. Each patch (also called a "chip") represents a different 2,560 by 2,560 meter area of forest. The data were collected over a period of 5 years between 2016 and 2021. Each label in this challenge represents a specific chip, or a distinct area of forest. LiDAR measurements are used to generate the biomass label for each pixel in the chip. For each chip, a full year's worth of monthly satellite images for that area are provided, from the previous September to the most recent August. For example, for a LiDAR-based reference label chip from 2020, monthly satellite data is provided from September 2019 to August 2020. All of the satellite images have been geometrically and radiometrically corrected and resized to 10 meter resolution. Each resulting image is 256 by 256 pixels, and each pixel represents 10 square meters. Images represent monthly aggregations and are provided as GeoTIFFs with any associated geolocation data removed. You only need to generate one biomass prediction per chip, but can use as many of the chip's multi-temporal (different months) or multi-modal (Sentinel-1 or Sentinel-2) satellite images as you like. Predictions should include a yearly peak AGB value for each 10 by 10 pixel in the chip.

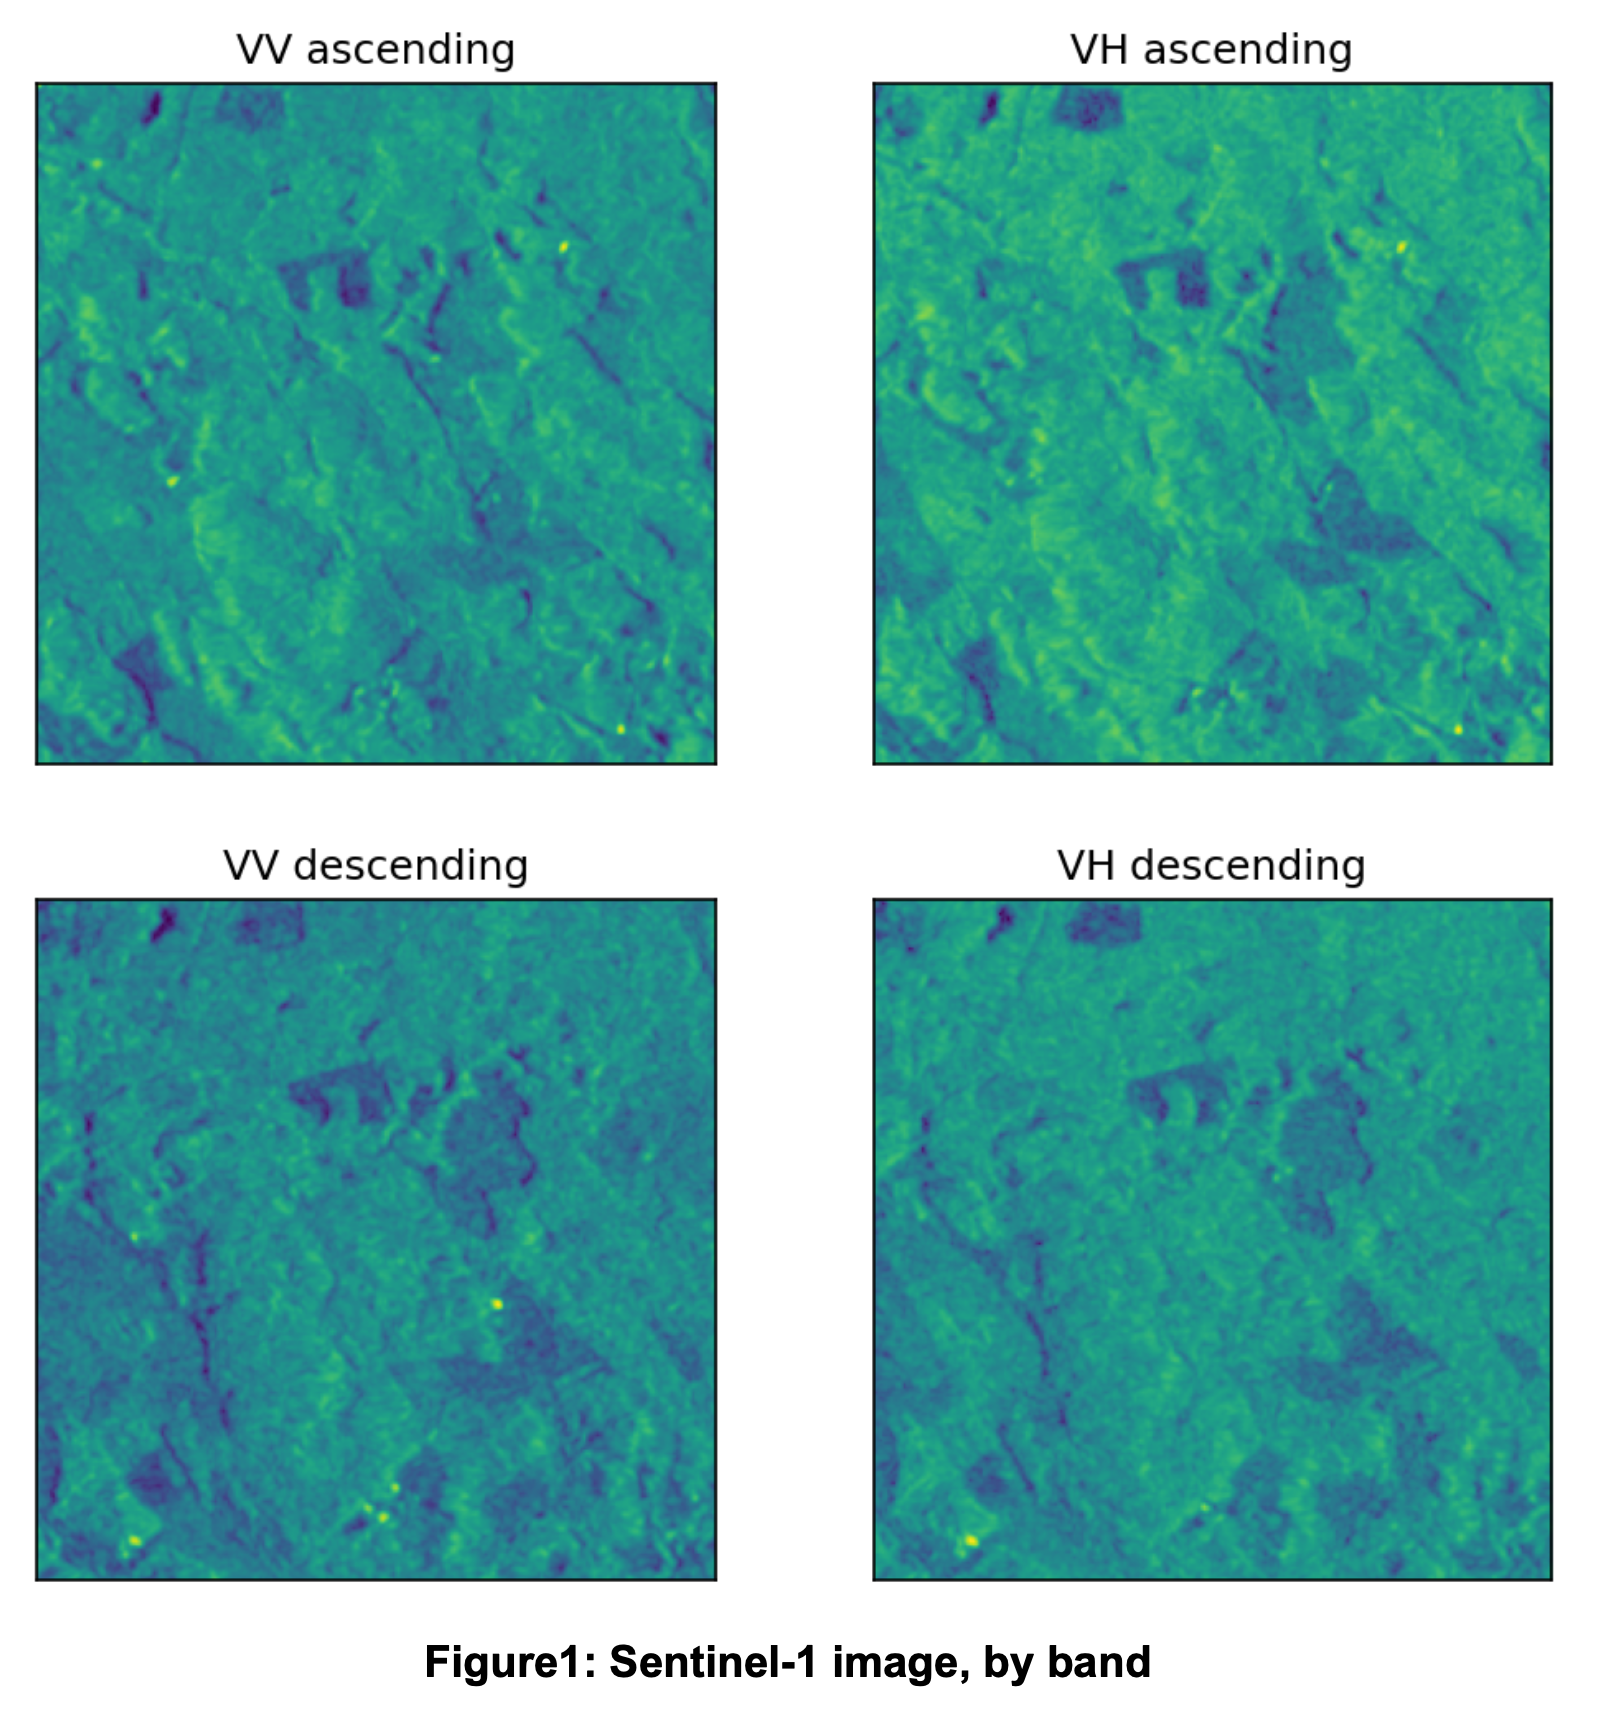
Example of a Sentinel-1 image: 001b0634_S1_00.tif is an image from Sentinel-1 provided as a part of the training dataset. The filename follows the format {chip_id}_{satellite}_{month_number}.tif, so we know that the chip_id is 001b0634 and that the image was captured by Sentinel-1 in September (the month number corresponds to the number of months since September).

Sentinel-1 ASC and DSC VV/VH Bands

BibTeX

@inproceedings{
nascetti2023biomassters,
title={BioMassters: A Benchmark Dataset for Forest Biomass Estimation using Multi-modal Satellite Time-series},
author={Andrea Nascetti and RITU YADAV and Kirill Brodt and Qixun Qu and Hongwei Fan and Yuri Shendryk and Isha Shah and Christine Chung},
booktitle={Thirty-seventh Conference on Neural Information Processing Systems Datasets and Benchmarks Track},
year={2023},
url={https://openreview.net/forum?id=hrWsIC4Cmz}
}
            

}